Projected Volatility Ranges
David Swensen on market mispricings:
“The opportunity’s greatest where assets are least efficiently priced.”
In Chart View, you have the ability to add Projected Volatility Ranges for the Monthly, Weekly and Daily time horizons.
Projected Volatility Ranges are Hedge Fund & Institutional level tools which reflect real time market priced probabilities for how far each asset is likely to move that Day, that Week and that Month with a sliding scale of probabilities
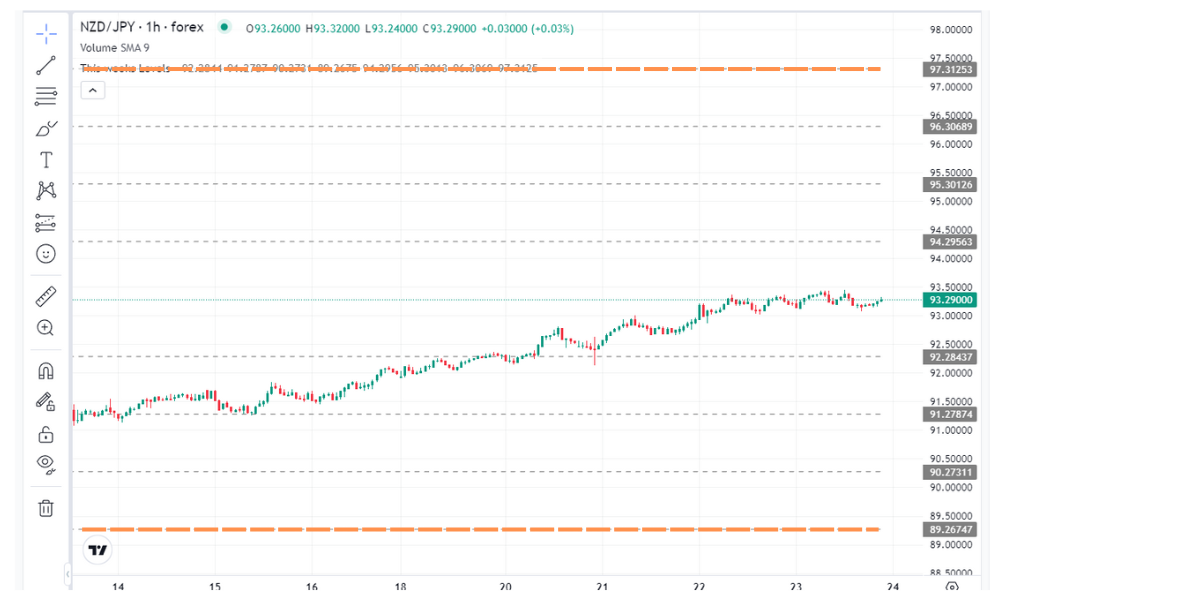
The Projected Volatility Ranges each comprise of an Upper and Lower Bound with each time horizon comprising of 4 ranges in total (Upper Bounds 1,2,3,4 and Lower Bounds 1,2,3,4)
The probabilities of an asset being contained within each range within a given time horizon are as follows:
First Upper & Lower Bounds
Approximately 68% chance of the asset being contained between these levels
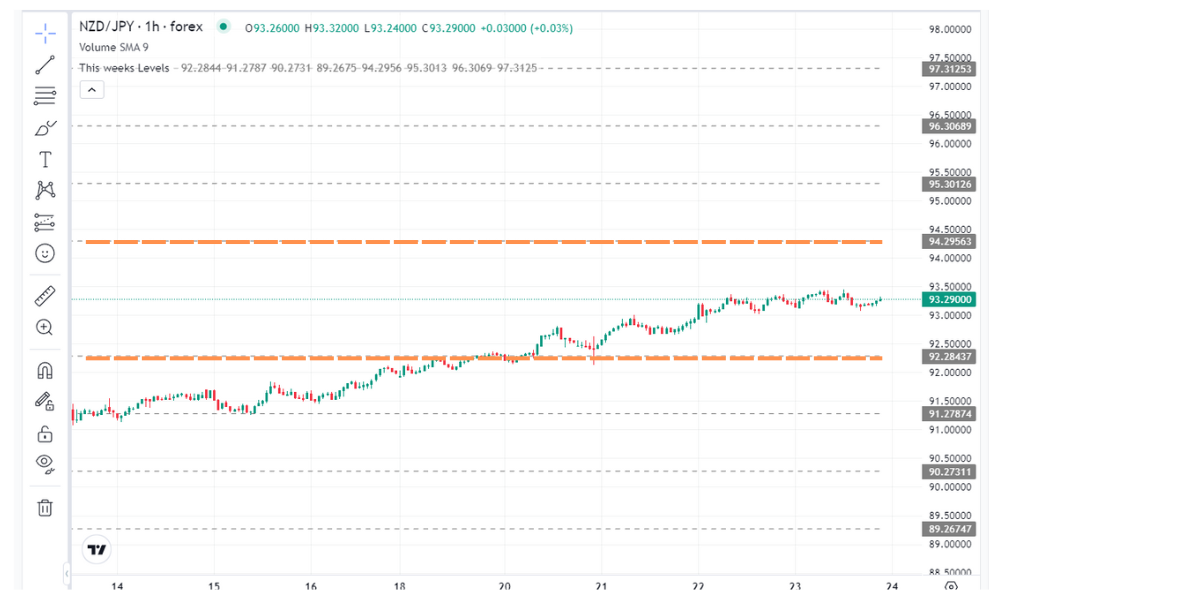
Second Upper & Lower Bounds
Approximately 95% chance of the asset being contained between these levels

Third Upper & Lower Bounds
Approximately 99.7% chance of the asset being contained between these levels
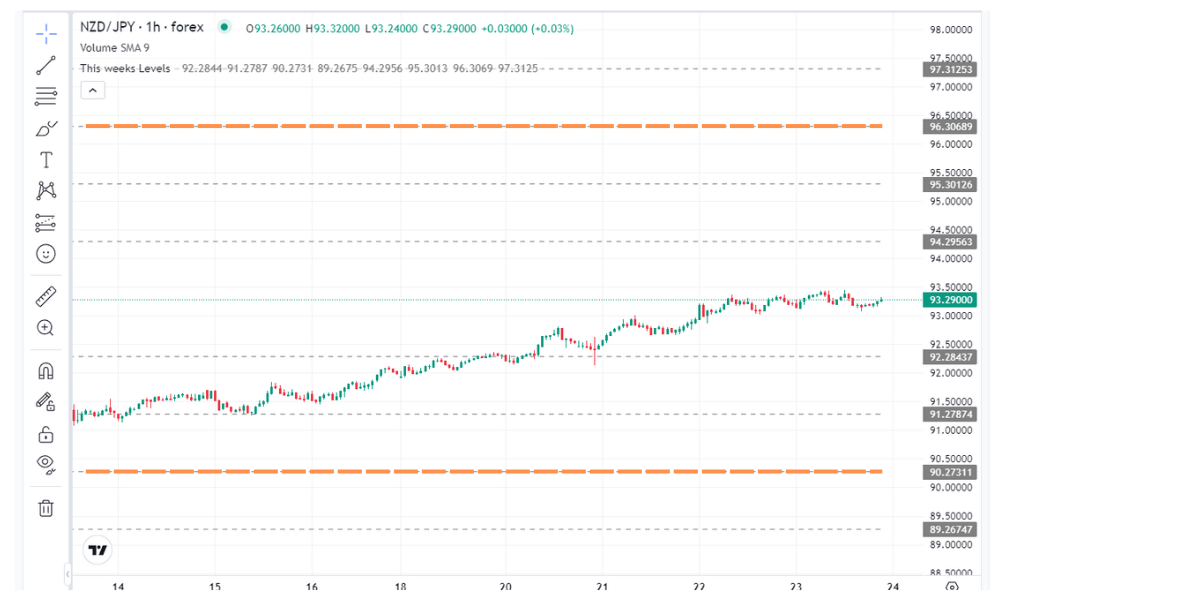
Fourth Upper & Lower Bounds
Approximately 99.9% chance of the asset being contained between these levels