Multi-Asset View (List)
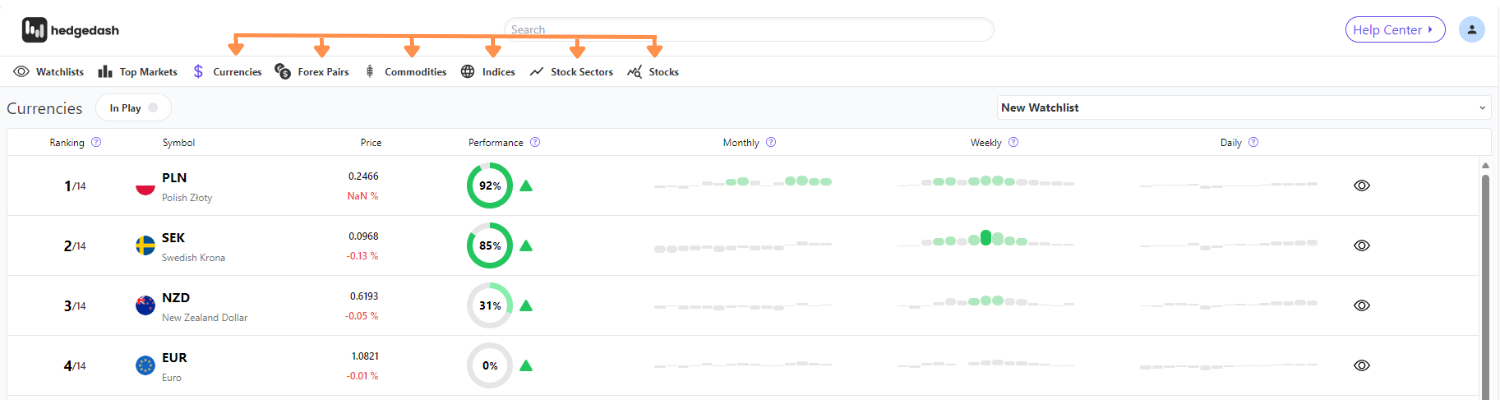
The Multi Asset List View is sophisticated tool for spotting and assessing the Leaders and Laggards in each asset class and will give you a significant advantage over the vast majority retail traders. Quickly identify the best trade opportunities in any asset class based on the relative strength of the structural trend (both bullish & bearish) of each asset
Important: Hedgedash uses professional grade, machine learning algorithms which calculate multiple variables to assess the relative strength of each assets trend, volume and volatility and should not be confused with the Relative Strength Indicator (RSI) which is a common and widely used lagging technical indicator
The Multi-Asset View has been specifically designed to overcome normal barriers to information when assessing the Structural and Cyclical conditions of an asset on a chart. Whereas most tools and indicators are displayed in-chart, the Hedgedash Multi-Asset List View provides much faster and more efficient access to each asset’s information by removing the need to click into and out of each assets chart, in order to view the tools and indicators of multiple assets
By removing the need to click in and out of charts to view the data for each asset individually, traders can scan through the Structural and Cyclical data of an entire asset class with one scroll of the mouse wheel!