Single-Asset View (Expanded)
The Single Asset (Expanded View) is an assembly feature to help bring together the three key pillars of Hedgedash (Relative Performance, Overcrowding and Projected Volatility Ranges) with charting features for each individual asset
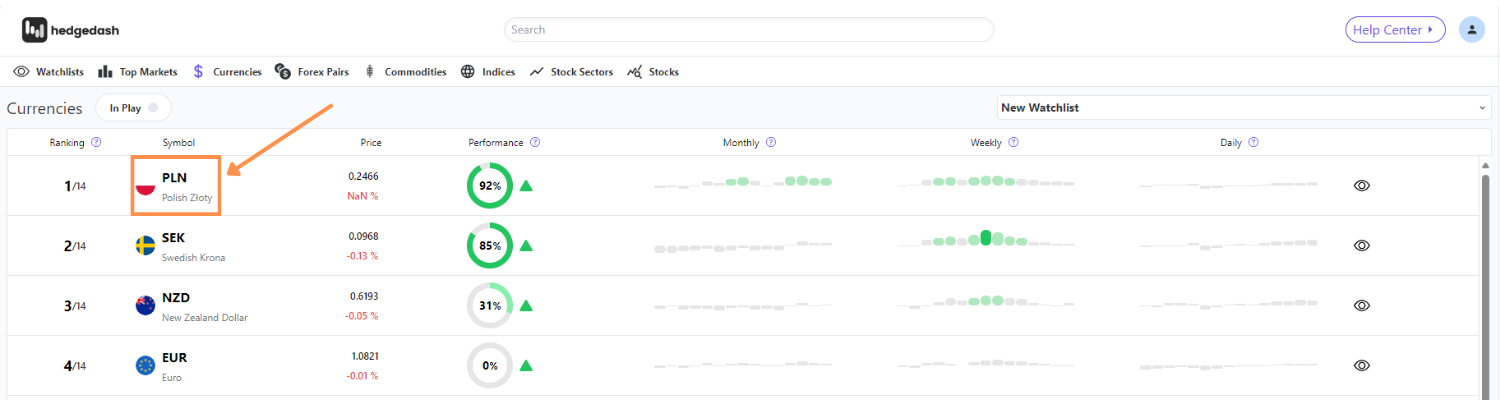
In order to enter the Single Asset (Expanded) view. Click on the symbol you wish to investigate from within the Multi-Asset (List) View
Asset Information Panel
In the top left of the Single Asset Expanded View is the Ticker Panel. This panel displays the ticker of the asset, the name of the asset, the current Price of the asset and the current daily change as a percentage.
Relative Performance Panel
The next panel down is the Relative Performance Panel. This displays the Rank of the asset relative to all other assets in the asset class as well as the Performance Wheel and Momentum Arrow
Overcrowding Panels
Underneath the Relative Performance Panel sits the Crowded Market Panels displaying the Overcrowding data for the Monthly, Weekly and Daily time horizons
Projected Volatility Ranges
The bottom panels on the left hand side display the Projected Volatility Ranges and the respective levels for the Monthly, Weekly and Daily time horizons. Each level has an alert icon next to it to display whether a level has been hit and an alert triggered for it
Each icon can be click to set an individual alert on a specific level, as well as to remove or reset alerts for any of the levels displayed
Chart
In the middle of the Single Asset Expanded View is an advanced charting feature that integrates the popular TradingView charting software
This interface allows for world class charting features to be used together with the cutting edge Hedgedash trading systems.